Organic click through rate has long been the subject of debate among SEOs. Many have suggested that higher organic CTRs can have a positive impact on rankings because they are a clear signal to the search engines of user intent. Despite sending mixed messages in the past, Google, now claims that CTRs do not have any impact on rankings. My personal opinion has evolved over the years, but from a broader perspective: it doesn’t really matter.
It doesn’t really matter if CTR impacts rankings, because SEOs should be optimizing their CTR no matter what. An increased CTR means more traffic from the search engines no matter what the rankings are doing. However one of the issues that I have always come up against, is how do I know if my CTR is good or not? I mean at some point I have to prioritize which pages I focus on, and I don’t want to waste time on pages that have reached their highest potential.
Many SEOs in the past have tried to answer this question by calculating an average CTR. While at the time those types of studies may have been helpful, they are now impacted heavily by things like featured snippets, rich results, and knowledge graph panels.
Therefore instead of using an average based on massive data sets, SEOs should rely more heavily on their own data to develop CTR baselines that they can optimize against. Doing so accounts for the context your site find’s itself in the SERPs. Below is a method that you can use to develop your own CTR baselines. I originally got the idea for this from my buddy Ryan Jones (thanks Ryan!).
How to find your CTR baseline for SEO.
- Login to Google Search Console for the site you are analyzing. Go to the Performance Report.
- Select “Web” for Search Type and at least 3 months of data. Make sure to select “Average CTR” and “Average Position”. And we are going to want to segment this for “Pages”. So your dashboard should look something like this.
- Export the data to your choice of a CSV or Google Sheets.
- Open up the exported data and add an additional column next to the Position column.
- We need to round the average positions to the nearest whole number to make the data more docile. In Excel we can use the ROUND function which is almost the same in Google Sheets. Round the values in the Position column to the nearest whole number in the column you added in step 4.
- Now its time to replace the values in the Position column with the new rounded values you created in step 5. To do this, you need to copy the new rounded numbers and then paste them on top of the values in the Position column. Make sure you are pasting “Values” and not “Functions”. Now your Position column should contain the closest whole numbers of each average position.
- Finally we need to create a pivot table using the Position and CTR columns. Highlight both columns and Insert Pivot table. Select Position as the Rows and CTR as the Values. Usually the default formula for values is SUM so you will need change that to AVERAGE.
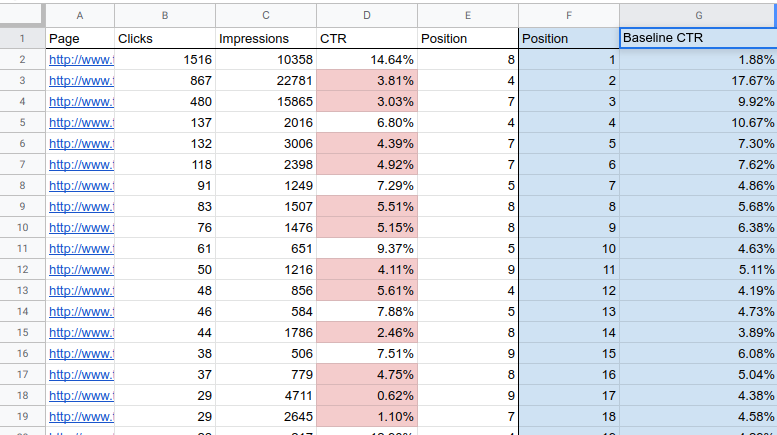
The resulting pivot table created in step 7 contains the average CTR baselines for each position listed. You can use this data by comparing the CTR seen in Search Console against the same for each position in the pivot table.
For example in the screenshot embedded above we can see our baseline pivot table shaded in blue. The page listed on Row 3 has an average (Rounded) position of 4 and a CTR of 3.81%. If we compare this to our baseline pivot table we can see that the average CTR for position 4 is 10.67%. Which means that the page found in Row 3 is getting a statistically low CTR for its position and needs to be optimized. You can make this type of analysis easier by using some conditional formatting to highlight Rows that fall under the baseline with a different shade background, like I have done in red.
Notable caveats to this analysis…
To preemptively silence the haters and naysayers I should probably offer a few caveats to this analysis.
- There’s a lot of extrapolation going on here. Because we have rounded the average positions and then averaged the CTRs associated with each, we have casted a larger scope of possibility than might serve useful, especially if you are using a small data set. Be mindful that this type of analysis only works if you have a large enough data set.
- Percentages of any kind can be misleading. For example a page might get 2 impressions, and 2 clicks with in your data set. Which results in 100% CTR. If enough of those low volume pages all rank in the same position it will seriously throw off your baseline for that position.
- Even though these baselines are subjective to your own data set, they are still based on the entirety of site’s data. If you want a more segmented granular approach I suggest you take a look at a similar analysis that uses the R programming language to segment this type of data further than just ranking position.
I really don’t want to write this paragraph, because I feel like there’s not really anything left to say here. But not adding a conclusion paragraph sort of feels like going to work in the morning without any shoes on. So anyways, now you are well equipped to discover your own CTR baseline using the method outlined above. You can run this analysis, optimize against it, and do the whole process again after a few months, to continuously optimize CTR on an ongoing basis. Good luck!
Daniel Chege says:
As an SEO specialist myself, I will advice everyone to know their click through rate, so they can track their website ROI (return on investment ), otherwise your website will not perform better on Google. A good web designer should have SEO knowledge as well.